MSM-analysis for alanine-dipeptide
This notebook collects usage examples for MSM-analysis using members of the pyemma.msm.analysis package.
A given MSM, estimated from alanine-dipeptide simulation data at lagtime \(\tau=6ps\), is used as an example to carry out analysis.
The necessary inputs are:
- the transition matrix, ‘T.dat’
- the centers of the \((\phi, \psi)\) dihedral angle space regular grid discretization, ‘grid_centers20x20.dat’
- the largest set of connected microstates, ‘lcc.dat’
Auxiliary functions in ‘plotting.py’ are used to generate figures of the estimated quantities.
Use ipythons magic % commands to activate plotting within notebook cells
%matplotlib inline
Imports are ordered as
- standard library imports
- third party imports
- local application/library specific imports
import numpy as np
from pyemma.msm.io import read_matrix
from pyemma.msm.analysis import stationary_distribution, eigenvectors, eigenvalues, timescales, pcca
import plotting
Load necessary input data
Use pyemma.msm.io.read_matrix function to read dense arrays from ascii files. The returned objects will be dense arrays (numpy.ndarray).
T=read_matrix('T.dat')
This notebook collects usage examples for MSM-analysis using members of the pyemma.msm.analysis package.
Starting from
centers=read_matrix('grid_centers20x20.dat')
The optional dtype (data-type) keyword allows you to specify the type of the read data. The default value is dtype=float.
lcc=read_matrix('lcc.dat', dtype=int)
Use the integer values given by the largest connected set as indices to “slice” the array of grid-center points. The returned array contains only those centers corresponding to the mircrostates in the largest connected set.
centers=centers[lcc, :]
Compute the stationary distribution using the pyemma.msm.analysis.stationary_distribution method.
pi=stationary_distribution(T)
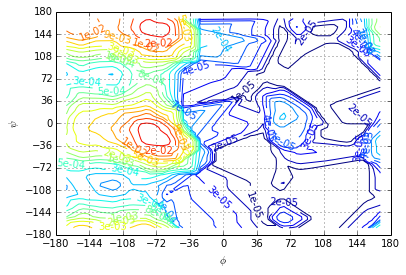
The (centers, pi) tuple is fed into an adapted plotting subroutine producing a contour plot from the scattered data. Since scatterd data can not directly be used to produce a contour plot over the whole \((\phi, \psi)\)-plane the given data is interpolated onto a regular grid before producing a contour plot. Some of the strange-looking low probability iso-lines may be artefacts of the interpolation. Interpolation on the level of free energies is probably a better idea.
plotting.stationary_distribution(centers, pi)
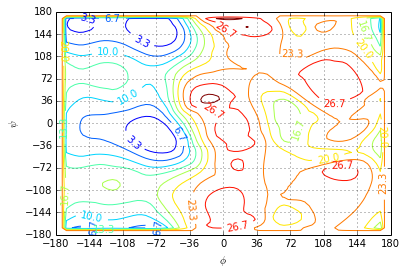
For \(T=300K\) we have \(\beta=0.4 \frac{mol}{kJ}\). The free-energy is defined as \(A_i=-\frac{1}{\beta} \log \pi_i\)
A=-1.0/0.4*np.log(pi)
Since we can only estimate free-energy differences we set the \(\min{A_i}=0\)
A=A-A.min()
For plotting we chose the equally spaced contour levels in the interval \([0, 30] \frac{kJ}{mol}\). For the interpolation onto a regular grid we chose cubic splines. Grid points that lie outside of the convex-hull of the given center points are assigned the maximum value of \(A\).
The plot shows the separation of the dihedral plane into a low (free-)energy region $ 0 $ and the region of high free-energy \(\phi >0\).
- The low lying region contains three metastable sets seperated by a barrier of approximately \(4 \frac{kJ}{mol}\) and approximately \(10 \frac{kJ}{mol}\).
- There are two metastable sets in the high energy region seperated by a barrier of approximately \(7 \frac{kJ}{mol}\).
- The barrier between the low energy and the high energy region is approximately \(23 \frac{kJ}{mol}\).
plotting.free_energy(centers, A, levels=np.linspace(0.0, 30.0, 10), method='cubic', fill_value=A.max())
Eigenvectors
We compute the right eigenvectors corresponding to the 4 largest eigenvalues.
R=eigenvectors(T, k=4)
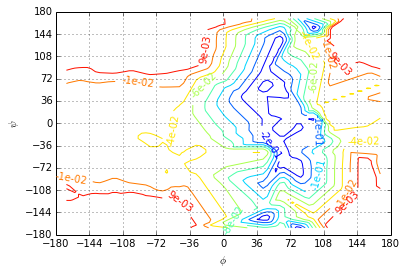
The first eigenvector shows a sign change from the most stable region with \(\phi \leq 0\) to the \(\phi>0\) region. The slowest process corresponds to a transition between the two most stable states and the metastable regions with \(\phi>0\).
ev=R[:, 1].real
plotting.eigenvector(centers, ev, levels=np.linspace(ev.min(), ev.max(), 10))
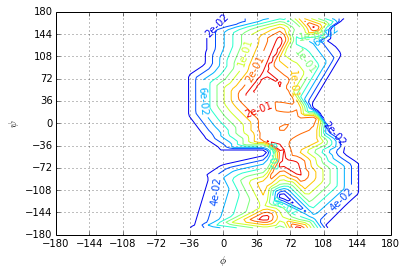
The second eigenvector shows a sign change from \(\phi \leq 0\) to \(\phi>0\). The second slowest process is the transition between the low-probability region \(\phi>0\) and the high probability region \(\phi \leq 0\).
ev=R[:, 2].real
plotting.eigenvector(centers, ev, levels=np.linspace(ev.min(), ev.max(), 11), fmt='%.e')
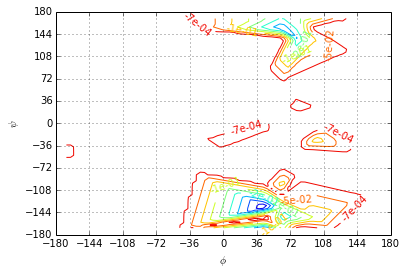
The third eigenvector shows the transition process between the least probable meta-stable state and the rest of the accessible state space.
ev=R[:, 3].real
plotting.eigenvector(centers, ev, levels=np.linspace(ev.min(), ev.max(), 11), fmt='%.e')
Eigenvalues
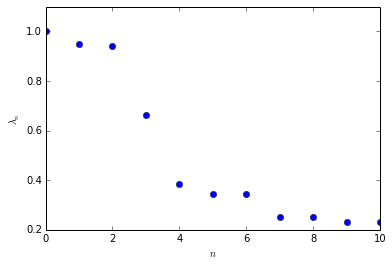
Compute the 10 largest eigenvalues of the MSM
eigvals=eigenvalues(T)[0:11]
The first \(5\) eigenvalues are purely real. The remaining eigenvalues occur in complex-conjugate pairs. That is because \(T\) is a matrix with purely real entries.
eigvals
array([ 1.00000000+0.j        ,  0.94808553+0.j        ,
        0.94092025+0.j        ,  0.66447475+0.j        ,
        0.38530146+0.j        ,  0.34550046+0.00929879j,
        0.34550046-0.00929879j,  0.24977533+0.25204877j,
        0.24977533-0.25204877j,  0.23257796+0.19019451j,
        0.23257796-0.19019451j])
There is a distinct gap in the spectrum betwenn the third and the fourth eigenvalue.
plotting.eigenvalues(eigvals)
Implied time scales
Implied time scales are computed via msm.analysis.timescales. The lagtime of the Markov model, \(\tau=6 ps\), can be specified via the optional keyword tau. The default value is tau=1.
ts=timescales(T, k=5, tau=6)
ts
array([          inf,  112.54805277,   98.52720209,   14.67859726,
          6.29109374])
PCCA
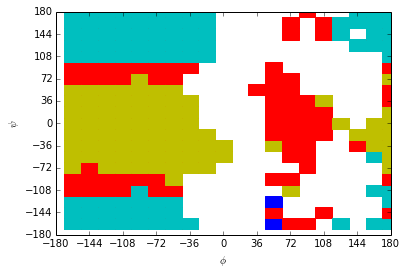
membership=pcca(T, 5)
membership_crisp=np.where(membership>0.4)
PCCA gives accurate memberships for the high probability region. Assigning correct memberships for the low probability states, \(\phi>0\), is problematic.
plotting.pcca(centers, membership_crisp)
Summary
The pyemma.msm.analysis module can be used to analyse an estimated transition matrix. Starting from the transition matrix \(T\) It is possible to
- compute the stationary vector \(\pi\) to analyze the free-energy landscape given suitable (low-dimensional) coordinates
- compute the right eigenvectors to investigate slowest dynamical processes
- compute eigenvalues and time scales as quantitative information about system-dynamics
The pyemma.msm-API is designed to allow fast and flexible scripting of the whole estimation and analysis process. There is a multitude of functions for MSM analysis provided in the emma2.msm.analysis module. Further functions are
- checks for stochasticity, ergodicity, etc.
- commitor computation
- TPT
- mean-first-passage time (mfpt) computations
- fingerprint: expectation and autocorrelation
- decompositions in eigenvalues, left, and right eigenvectors
We are happy for your feedback and suggestions. Please feel free to contact our mailing list at emma@lists.fu-berlin.de